
Using Financial Data Visualization to Help Spur a Data-Driven Culture
Through our research we have learned the most successful finance organizations – fewer than 6% of the total surveyed – understand that the finance department must become a trusted partner with the business to ensure a successful digital transformation.
“Digital champions,” - companies that are excelling at digital transformation - know that finance needs to influence the establishment of a new, data-driven culture, of which data visualization plays a significant role.
Helping finance professionals tell their organization’s financial story in a way that everyone understands accelerates management decision-making, leading to better KPIs and an improved competitive position. Bringing the story of your financial data to life makes it easier to draw your stakeholders’ attention to the right data to focus on and the right questions to ask.
This, in turn, takes informed decision-making to the next level and is why digital champions embed the finance department in their digital transformation journey.
What is Financial Data Visualization?
As the name suggests, financial data visualization is the act of taking financial data and presenting it visually. In other words, instead of presenting financial data as simple text or in a basic grid, finance departments can use data visualization tools to display data in the form of a chart, graph, or other visual element – often with interactive features as well.
Some common data visualization graphics are:
Dashboards
Heat maps
Line or bar charts
Histograms
Scatterplots
Area charts
Pie charts

Benefits of Data Visualization
Data visualization is about presenting data in way that is engaging, informative, and easy to digest. Organizations that properly implement financial data visualization can realize multiple benefits in addition to informed decision making – for example:
Better engagement
Financial data sets can be dull and difficult to grasp, especially when the set is particularly dense or complex. By presenting data in a visually appealing manner, finance departments can improve audience engagement.
Faster comprehension
Financial data visualization is not only more interesting, but it also helps viewers more quickly understand what they’re seeing.
Emphasized insights
Without data visualization, important points can get lost in a sea of numbers. Visualization helps emphasize key insights so that viewers can take note and act accordingly. In addition, finance departments can create visuals that display data in a way they may not have thought of previously, to better communicate the importance of these crucial insights.
Better data access
Visualization tools can help all users – not just those that are tech-savvy –access the right data in a form that is easily understood.
What New Analytics Capabilities Are Organizations Building?
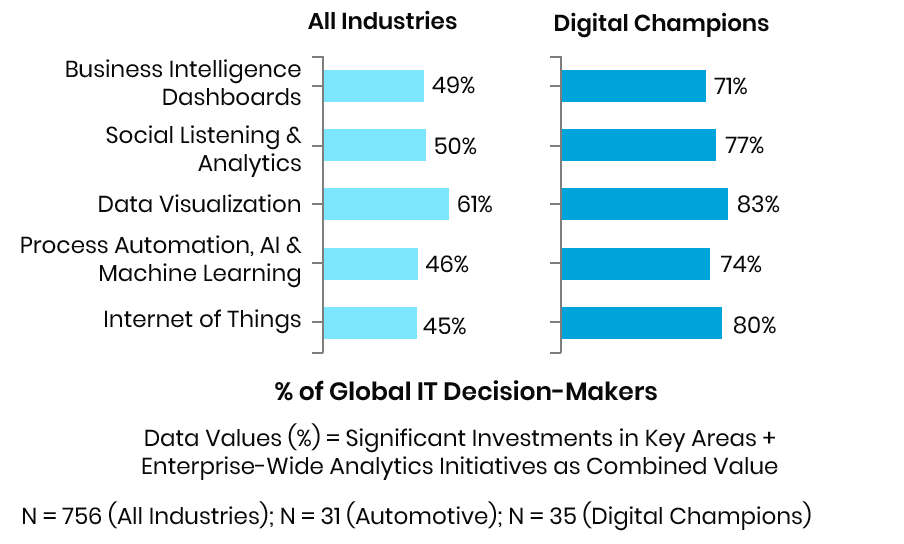
Copyright © 2021 Trianz
Bring Your Financial Data to Life: Visualization Tools
Organizations can choose from a variety of data visualization tools, such as the following:
PowerBI
PowerBI is a visual analytics platform, and dashboards are the delivery mechanism. A data analytics consulting services provider can work with Microsoft and your business to create customized dashboards for finance and other specific departments or design specialized executive dashboards to help with decision-making processes.
These dashboards adhere to data security and compliance policies using role-based access controls (RBAC), giving authorized employees access to data without overprovisioning. A consultant can also design visualizations that can be saved and reused indefinitely, offering your organization’s employees a quick and easy way to generate insights.
Tableau
Tableau requires data to function, and a data analytics consulting services provider can team with your business and Tableau to create pipelines that extract and load data to the platform. This data can come from any cloud platform or database dialect, thanks to Tableau’s platform-agnostic functionality.
From there, a consultant can identify and propose suitable visualizations from the Tableau public gallery or design custom visualizations around your specific business needs. These visualizations are then integrated into your finance professionals’ and others’ Tableau dashboards with data customization based on seniority (or department) for granular compliance and security controls.
Qlik
Qlik is an enabler of the analytics revolution, delivering real-time data analytics and actionable business intelligence. They specialize in data visualization, executive dashboards, and self-service BI products.
They also offer a complete range of analytics capabilities — “from self-service analytics to interactive dashboards and applications, conversational analytics, custom and embedded analytics, mobile analytics, reporting and alerting.” In addition, their products leverage AI and automation.
Looker
The Looker data analytics platform simultaneously offers modern BI and real-time analytics functionality in a unified platform. With this platform, you can extract and load data from various source databases, simplifying data discovery within Looker.
This converges data from multiple sources without compromising performance or security using Looker Data Connections that are both platform- and dialect-agnostic for ease of access. You can then leverage Looker’s data visualization functionality to generate graphs and charts.
Also Read: Salesforce Financial Services
Business Intelligence and Flexible, Real-Time Data Visualization
Finance departments need on-demand access to data to make informed decisions. Aggregating and presenting data in user-friendly formats requires a strong business intelligence (BI) framework with flexible visualization capabilities.
Your finance professionals need to be able to identify and illustrate key performance indicators (KPIs) and trends to avoid missteps, leverage opportunities, and predict what will happen in the future. For data-driven organizations, interactive dashboards and self-service BI and analytics have become the new, must-have business tools.
Relevant and accurate data provide the building blocks for actionable intelligence but are often scattered throughout an enterprise in siloed databases and systems. Organizations need to empower non-technical users with real-time information by integrating and converting this data into BI dashboards with intuitive graphics and analytics tools.
Business Intelligence Framework
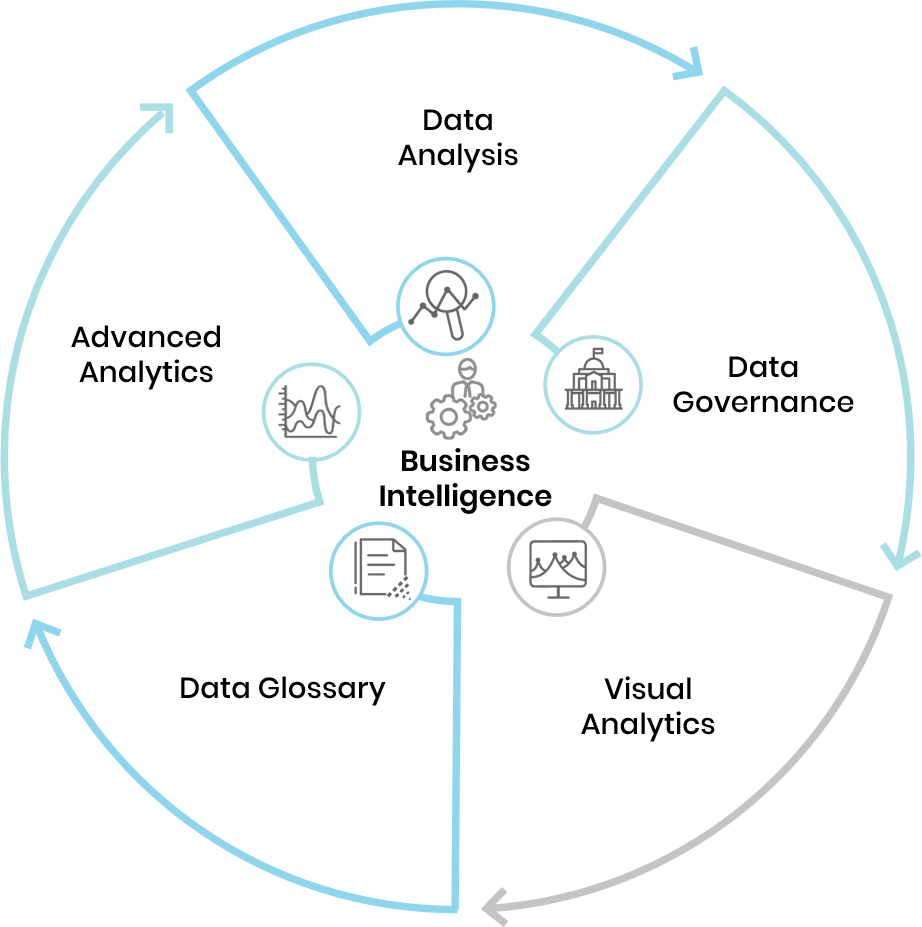
Copyright © 2021 Trianz
Start with a Strong Data Analytics Strategy
Data visualization can be a game changer for your finance department and your entire organization, but that’s only the case if your business has quality data and an effective data analytics strategy; or - if your data is in the cloud - a powerful cloud analytics strategy.
A data analytics consulting services provider can help you design the right strategy and plan for your business’s unique needs, enabling you to establish a data-driven culture and use predictive insights to make well-informed decisions.